 |
|||||||||
|
||||||||||||||||||||||||||||||||||||||||||||||||||||||||||||||||||||
|
|
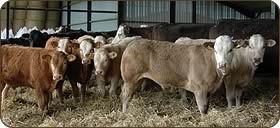
Top Suckler Herds Set Performance Standards
Even though they had some way to go to generate a profit without either subsidies or single farm payments, the better-performing herds provide a hugely valuable benchmark for national improvement efforts. In particular, the 2004/05 costings (for the 12 months to 31 March 2005) highlight a number of areas through which the majority of English suckler herds could significantly improve their physical and financial performance to reduce their reliance on single farm payments. First and foremost, top third producers had a calving period three weeks shorter than the average, minimising the number of lighter, late-born calves at sale time or the need for extra feeding. This and faster growth rates - presumably from better bred stock - meant an overall advantage of 25kg/head in average calf weights, worth £28/head, despite around 20kg/head less concentrate feeding. An additional calf reared per 100 cows further increased the output advantage of the better performing herds. Together with slightly lower variable costs, this gave a gross margin nearly £50/head higher than the average. It is in fixed costs, however, that the top third producers really stretched their advantage. Of the £72/head saving recorded over the average costed herd, more than 40% comes from the labour bill, 30% from land and property costs and 20% from power, machinery and fixtures. EBLEX English Lowland Suckler Herd Enterprise Costings 2004/o5
* All costs/prices are derived from aggregated data from real farm businesses in England ** Excludes the value of unpaid family labour The full English enterprise costings results will be available from the end of November. |
|||||||||||||||||||||||||||||||||||||||||||||||||||||||||||||||||||

|
|
|||||||||||||||||||||||||||||||||||||||||||||||||||||||||||||||||||
| home | agri-services | pedigree
pen | news | dairy | beef | machinery BPS | property | organisations | site map |
||||||||||||||||||||||||||||||||||||||||||||||||||||||||||||||||||||
 Earning net margins more than £120/cow* higher than the average in the latest English Beef and Lamb Executive (EBLEX) annual enterprise costings, the top third English lowland suckler herds set an impressive performance standard for the post-subsidy world. All the more so for the fact that they enjoyed no advantage in either herd size or calf sale prices.